We Crunched the Numbers to Discover Which Rules Truly Make a Board Game Great

We looked at BGG’s data from the top 100 board games of the last 20 years to find which rules make for a great game and which just land flat.
Before I became a purveyor of delightful Internet content, I was an engineer and did a fair amount of coding. I’ll occasionally delve back into the arts of technomancy just to keep my mind right, which is how and why you’re here right now, reading this.
Several years ago, I wrote up a Python script to flip through Board Game Geek and data crunch in order to find the most and least popular board game rule mechanics. However, a lot has changed since then. Mainly, BGG completely changed its game mechanics list. So, we’re back to try again.

Project Objectives and Design
Before starting any project, it’s important to really know what it is that you’re wanting to do, rather than vague concepts and ideas. So, I laid out my objectives.
- Gather a list of the most popular games in a given year range
- Find the mechanics of those games
- Graph the average rating and total count of each of those mechanics across each year in that range.
With the plan set, I put on my Oakley sunglasses and leather trench coat and got to work.
Find Popular Games
In order to find all the most popular games, I did a technique generally called Table Scraping. Basically, I told the code to look up the URL for performing an advanced search on BGG when you filter by year and sort by highest-ranked games. I would find the top games in that table, up to a given amount, and toss those in a big data table. Then, do another search the next year and do it again until I’ve searched every year I wanted to check.
A semi-important note, BGG has a bunch of different ways of ranking games: Rank, Geek Rating, and Average Rating, and they are all calculated differently. Over the course of this project, I was pretty flimsy with their use. I sorted by Rank but found the average Geek Rating. Just seemed good enough.
With the table fully scraped, I could move on to the second objective.
Collect the Board Game Mechanics
Board Game Geek does have an API, which is basically just a tool that you use to tell your code to talk to BGG a lot more easily, and that’s what I used to find the mechanics for each game in my full list.
It finally did its thing, I had a table listing each game mechanic across each year with the total number of times it was used in that year as well as the total average rating of each game released in that year that uses that mechanic. That last bit didn’t quite work as planned, but we’ll get to that in a bit.
Finally, I removed every instance of a mechanic only having 1 occurrence in a year since that felt like it would throw everything off too much by letting one game drive the mechanic’s rating as a whole.
The easiest part was graphing all the data and just swelling with pride at a project well completed. Now, with all the data fully crunched, let’s get to the exciting part!
Data Processing
In my final data pull, I looked at the top 100 games by Rank from 2002 to 2022. 20 years and 100 games per year seemed like a pretty good data set. But from a sample set, I plotted all the data and had a sudden urge to play Pick Up Sticks.
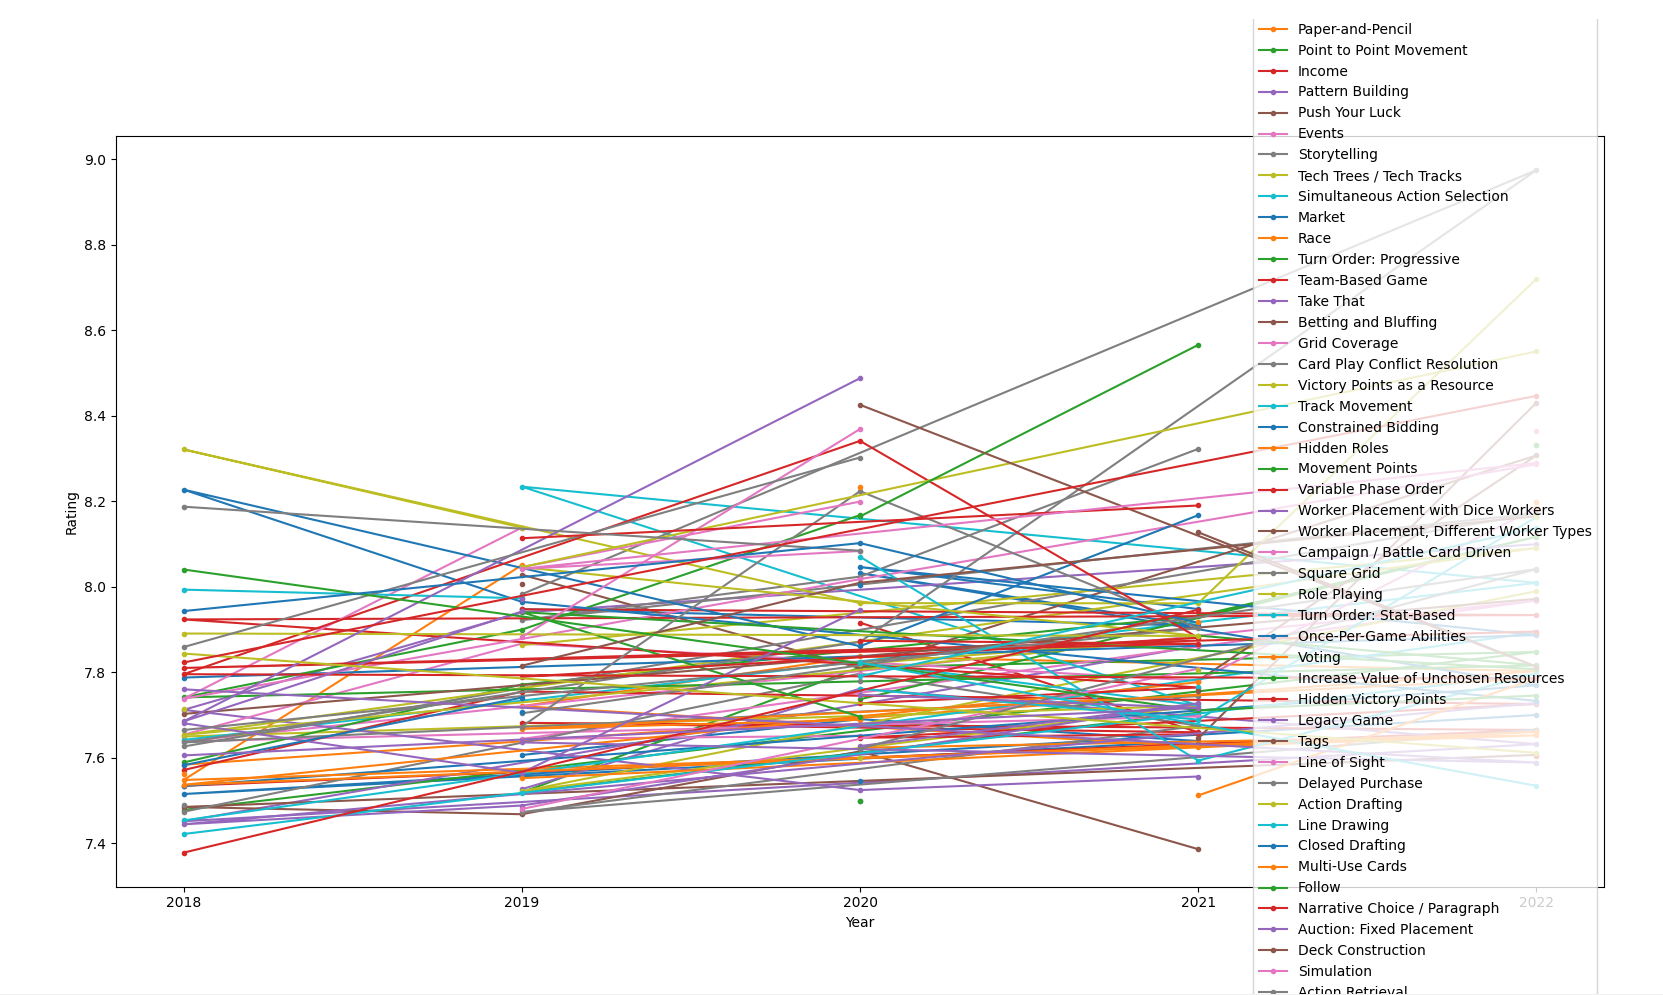
Clearly, there were too many board game mechanics, and the data was a jumbled mess. So, I decided I needed to clean up the data a little bit and filter it down some. To do this, I decided to only plot the top 10 mechanics. But, then I hit a snag. I realized that I could either grab the mechanics that got used the most often, or I could grab the mechanics with the highest average rating. Ultimately, I decided to do both!
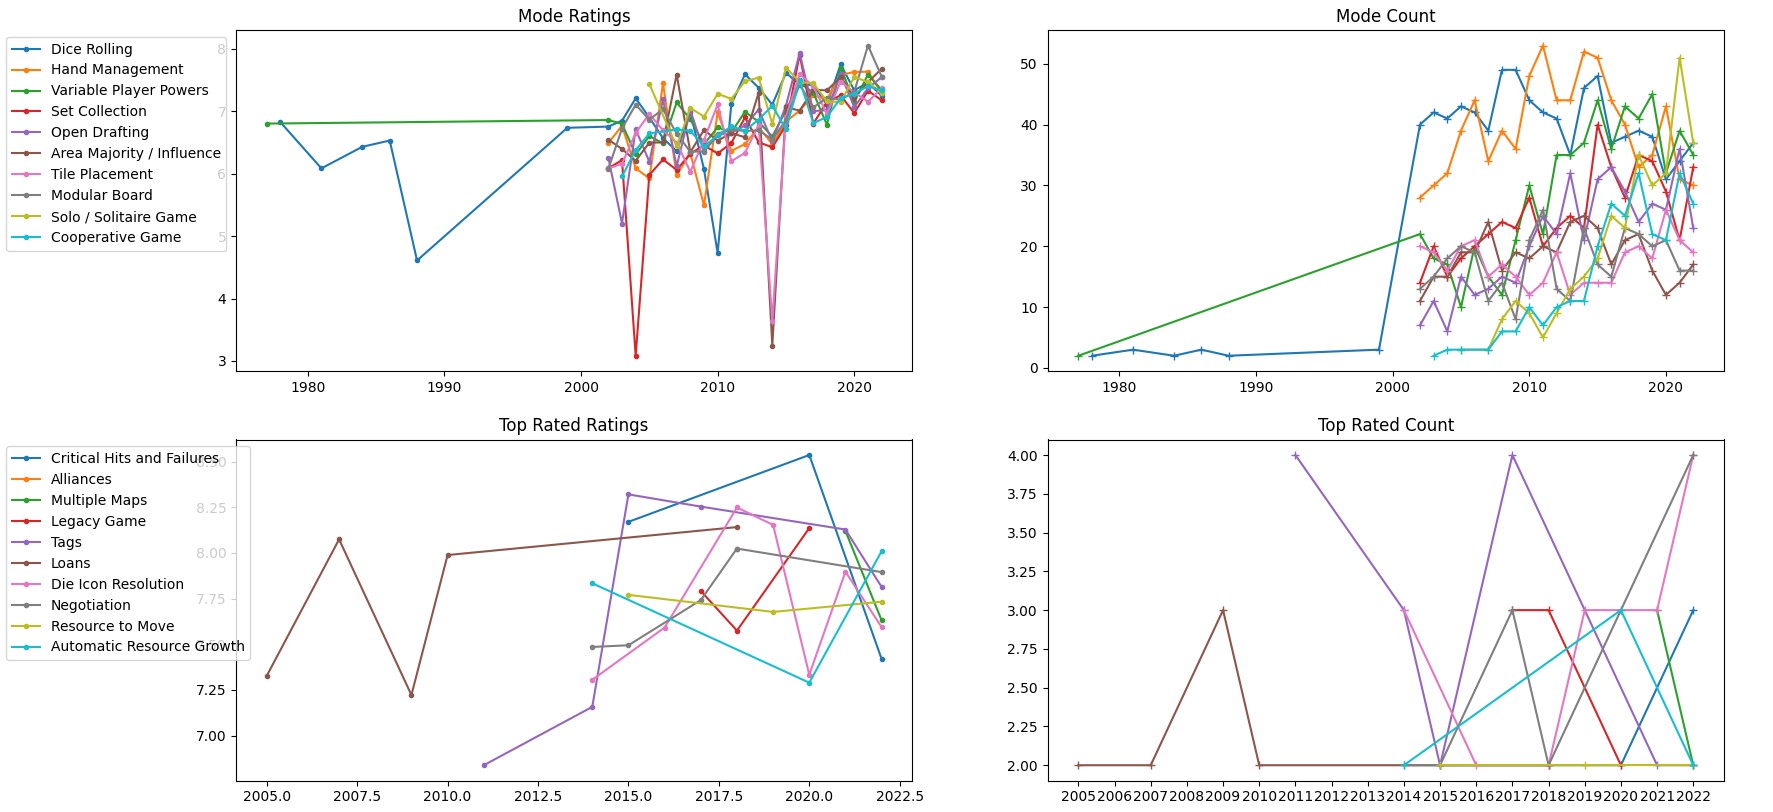
The above image is the result of all this hard work. Mode Ratings are the most commonly used mechanics and their average rating over the years, Mode Count is the number of times they were used. Top Rated Ratings and Count are using the mechanics with the highest average rating. The legend on the left applies to both graphs in that row.
Now, the fun part: making baseless assumptions on an incomplete dataset!
Data Analysis Conclusions
The first thing that jumped out to me was a couple of weird outliers. A few data points are just being loners way off by themselves. This happens for a couple of reasons, but mostly if a game gets a second edition or something, BGG will count the game as having been released that year, but also note its “Year” as its initial release year. It’s kinda inconsistent from a data analysis perspective, but from a user’s perspective, it makes a ton more sense to have every edition of a game as the same overall game.
Mode Ratings
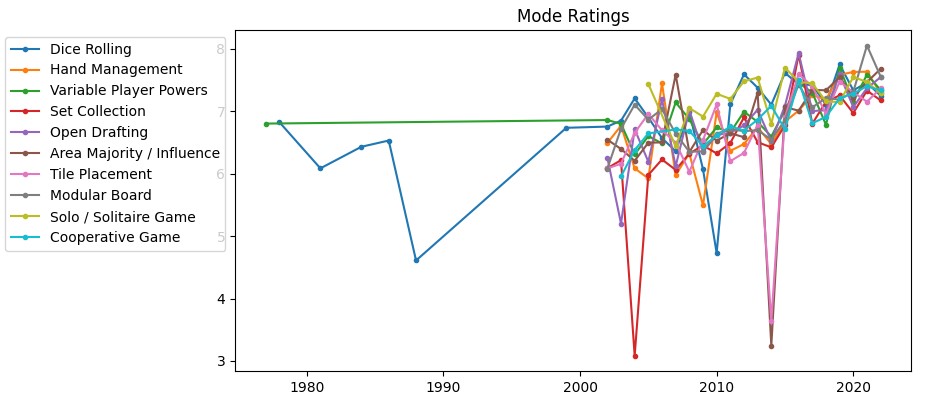
Out of every graph, this one is the most useful, I think. And there are a few interesting trends that jump out. Mainly, games are getting better over time. There is a very clear and obvious trend upward across all mechanics.
It’s not all that surprising the most common mechanics are Dice Rolling and Hand Management. Not every board game has either dice or a hand of cards, but they basically all do.
Mode Count
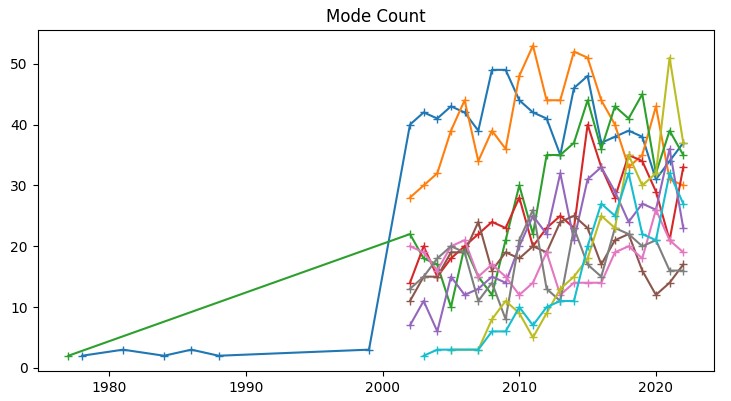
Like with Mode Ratings, there’s a clear upward trend here. This means games are getting more mechanics over the years. But, not super surprising when you think about it. Before the age of Catan, companies (other than Avalon Hill) weren’t making games as complicated as Twilight Imperium or Gloomhaven.
A fun line to notice is Dice Rolling in dark blue. It might seem like this data shows that games didn’t use dice before the year 2000. But, despite what I said earlier, don’t make baseless assumptions about an incomplete dataset. Remember, this data is only meant to be from 2002 to 2022. Still, it does seem like Hand Management (in orange) might be one of the board game rules that’s losing some of its popularity over the last 10 years.
Top Rated Ranking and Count
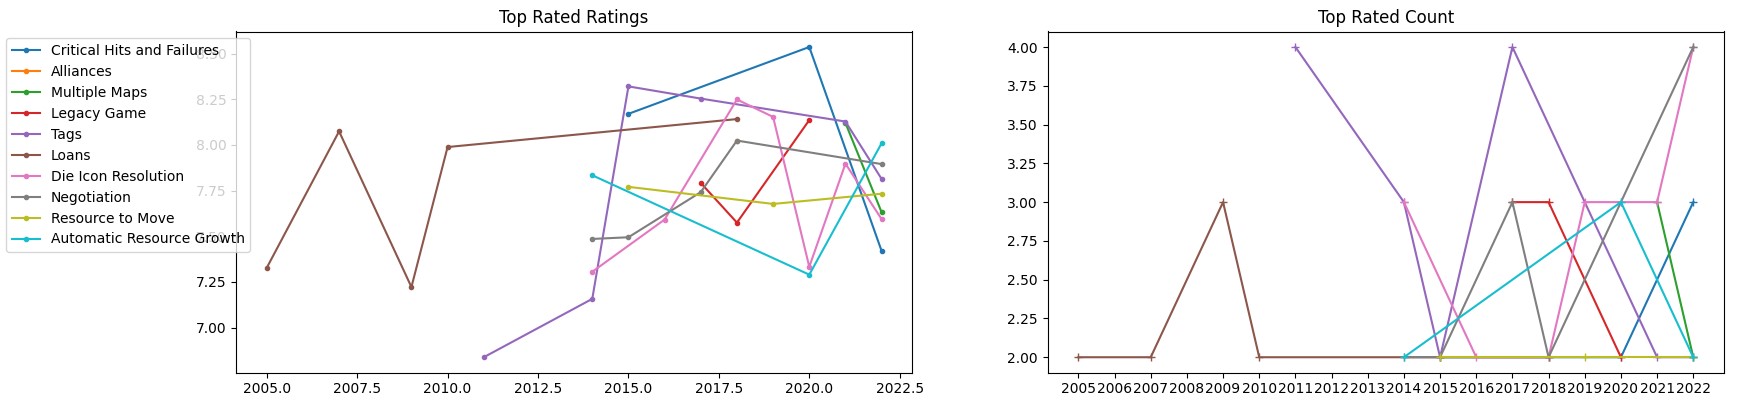
Both of these charts don’t really show anything useful, but I’m including them anyway, just for completeness. All of these mechanics suffer from the same cause: they have only been used a small handful of times, and those games just happened to be really good. There isn’t really anything useful to draw from either of those graphs.
Deep Data Dive
Numbers make my brain go brrr, so before calling the project finished, I scrolled through the full data table of board game rules manually and just tried to look for anything interesting. And I found a few fun things. Here are the board game rule mechanics:
- Were popular for a time but have basically died off now:
- Memory games
- Open Drafting
- Player Elimination
- Real-Time
- Roll / Spin and Move
- Secret Unit Deployment
- Simulation
- Are on the rise in popularity:
- Cooperative Games
- Pattern Building
- Scenario / Mission / Campaign Game
- Solo / Solitaire Game
- Story Telling
- Variable Player Powers
- Variable Set-up
- Worker Placement
- Have been pretty consistently liked:
- Action Points
- Simultaneous Action Selection
- Set Collection
- Team-Based Game
- Tile Placement
- Have had multiple ups and downs:
- Paper-and-Pencil
- Take That
- Traitor Game
Conclusion
I like coding and data analysis, so this was a fun project, and I really enjoyed it. If you’re curious, scroll through the full data table yourself and draw your own wild conclusions.
If you enjoy this sort of deep data dive, comment or even just hit me up on Instagram and let me know what you’d like to see so I can prove to my editor this was worth all the time and effort I put into it.